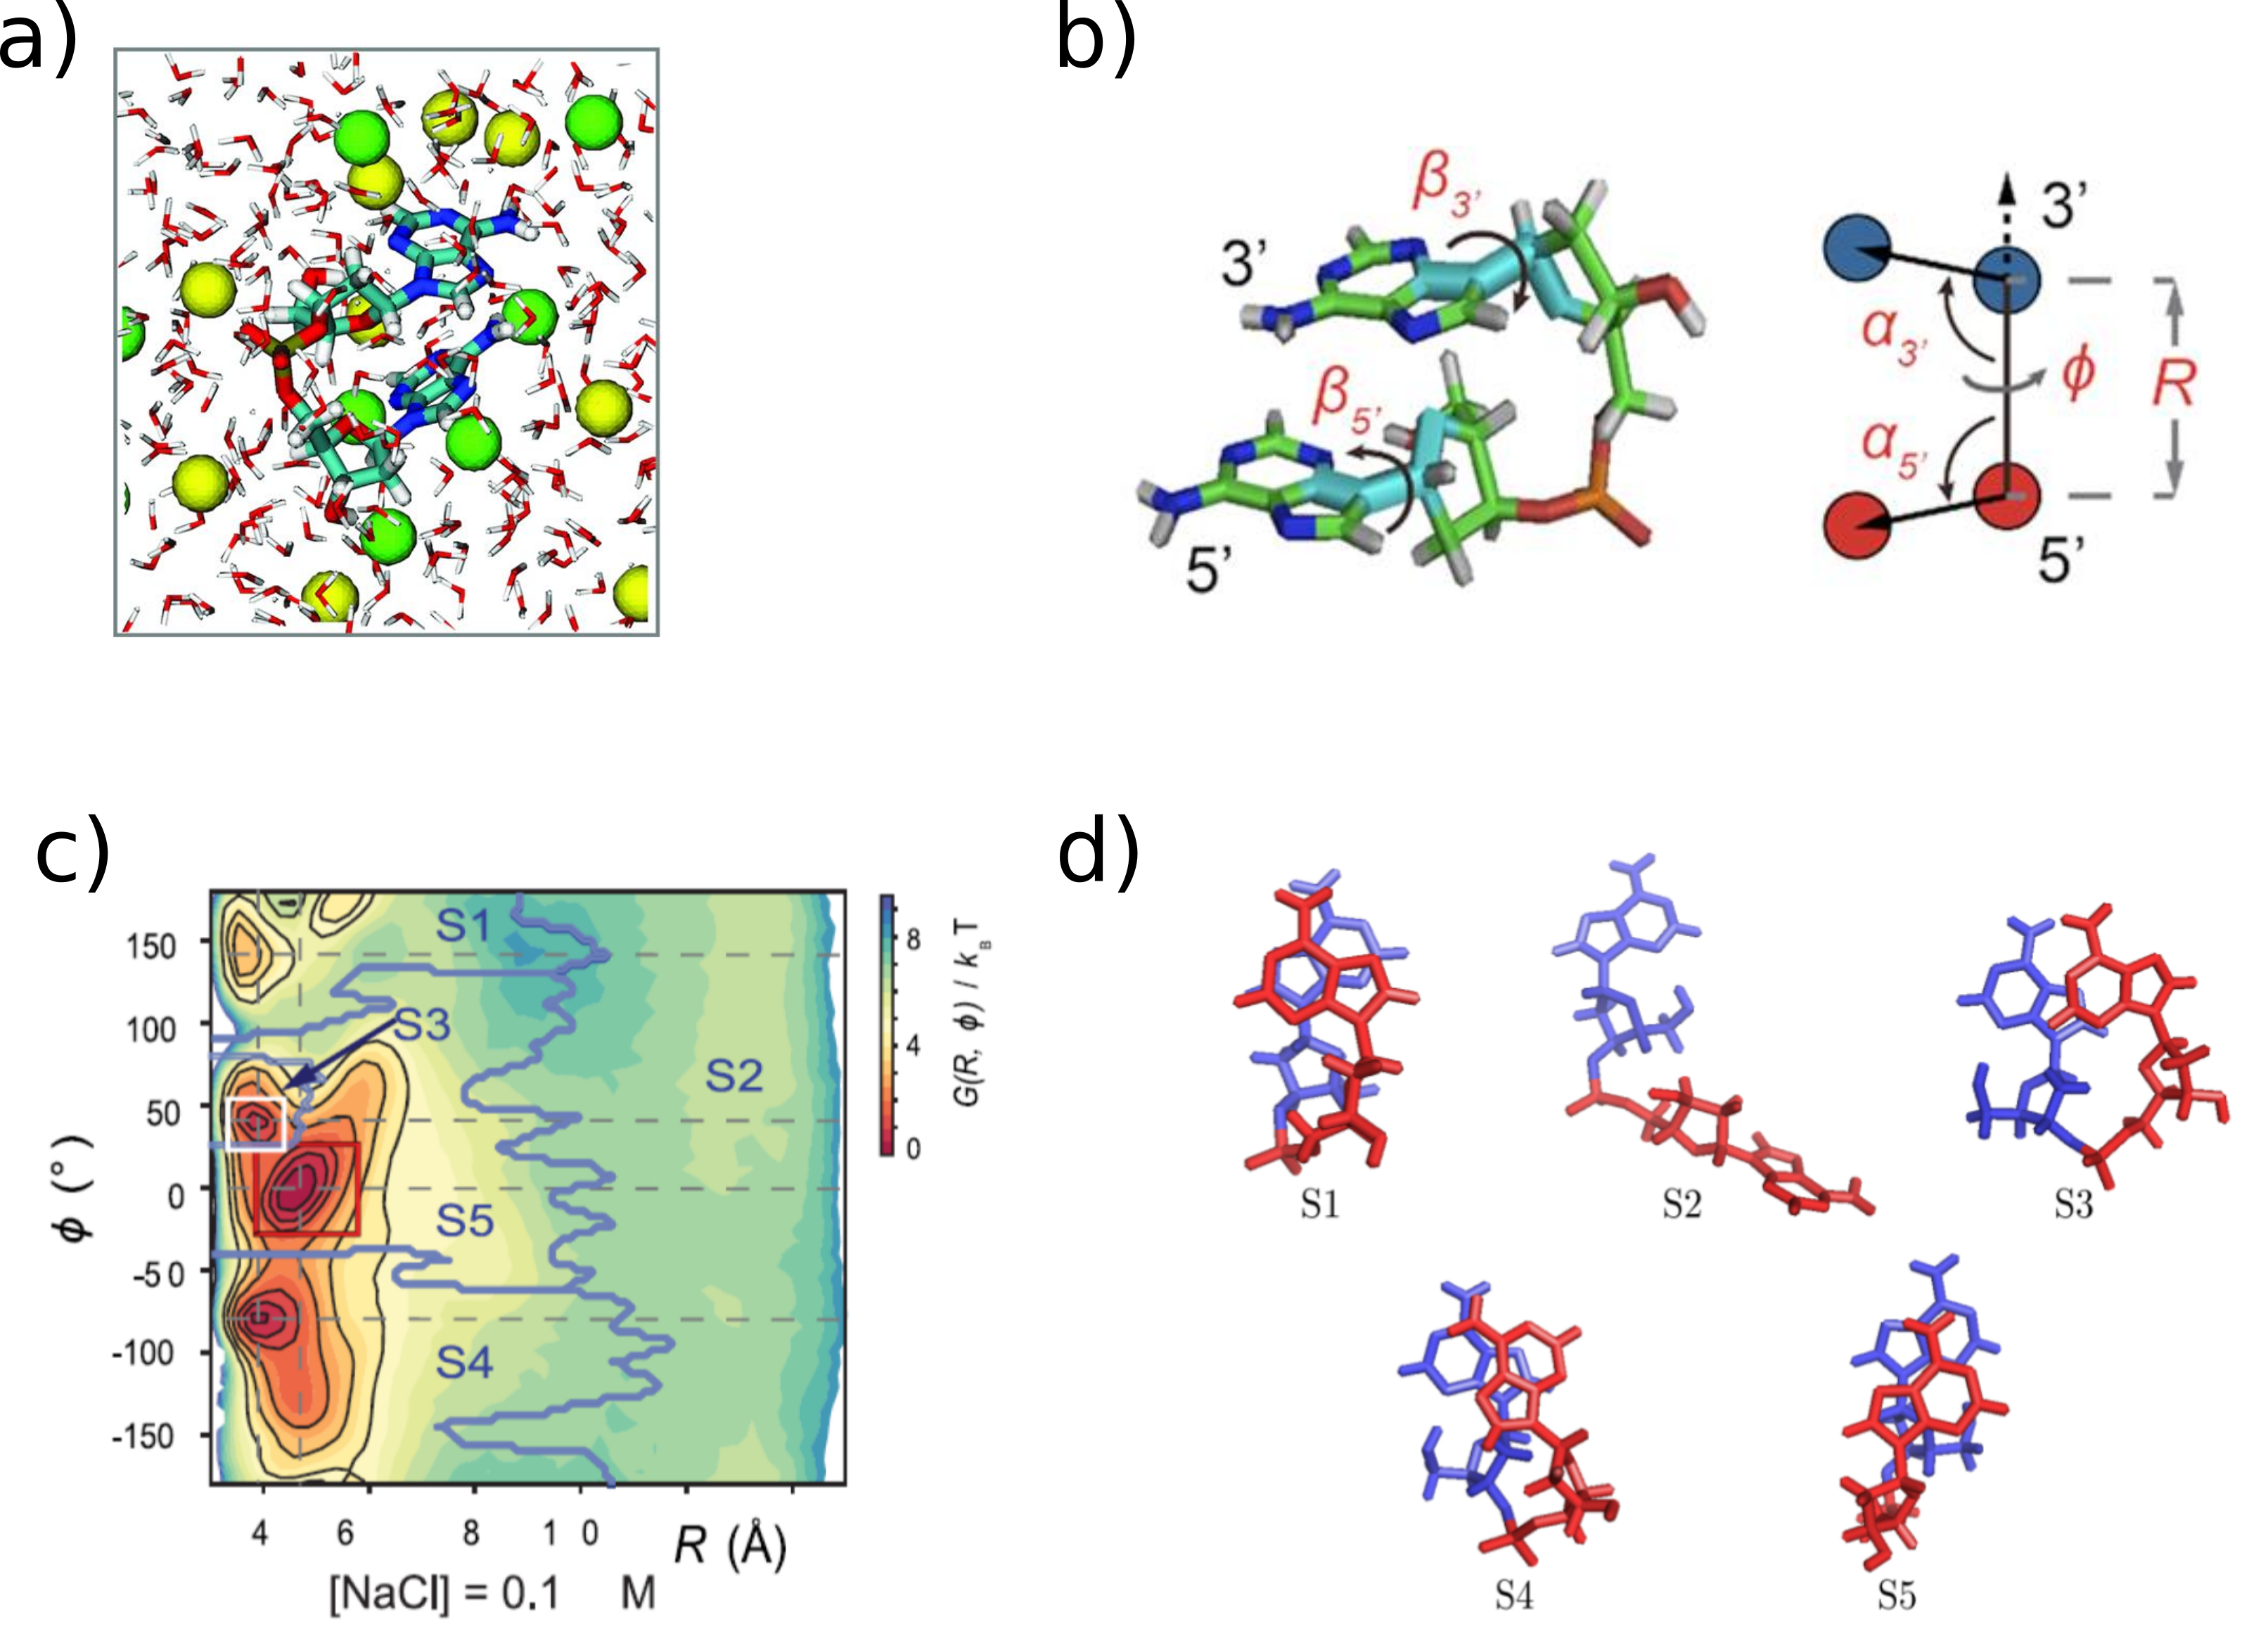
As another application of MSMs to biological systems, we performed long (1 microsecond) simulations of deoxyadenosine dinucleotide (dApdA) in aqueous solution of varying NaCl concentration. The free-energy landscape of the dApdA molecule projected in the two-dimensional space of the radial separation between the nucleobases and the twist angle around this axis was used to as the reduced state space for construction of an MSM that was subsequently coarse-grained using the robust Perron cluster-cluster analysis (PCCA+) method. The coarse grained transition matrix dedscribing the conditional transition probabilites among these coarse-grained macrostates was used to interpret the unstacking mechanism as well as its associated timescale. We find that each macrostate defines a physically relevant set of conformations, e.g. right-handed structures, left-handed structures, unstacked, stacked and achiral. The structural statistics in each macrostate was combined with Schellman's matrix method to calculate the circular dichroism (CD) spectra for each macrostate. We found that, in agreement with prior conjectures, that the CD spectrum is due almost exclusively to a linear combination of two states. However, in contrast to that conjecture, we found that the CD spewctrum is due mostly to the predominant left- and right-handed states, not a right-handed and unstacked state. Using the average CD from this state gave very similar results to using just the average structure from each macrostate. Thus, we provided a computationally convenient method to extract the relevant metastable states, a determination of how the conformational diversity of dApdA contributes to its CD spectrum, and postulate a mechanism, including the associated kinetics, for the unstacking transition of this simple nucleic acid system.